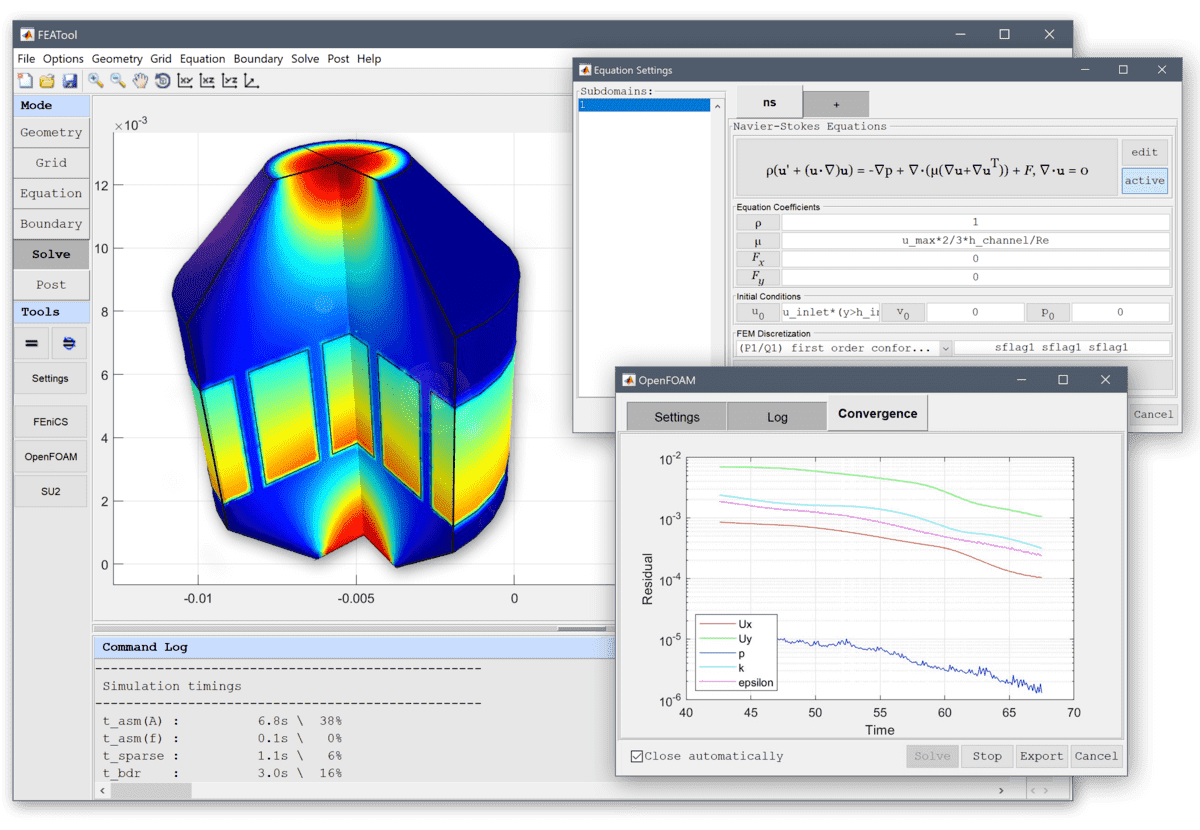
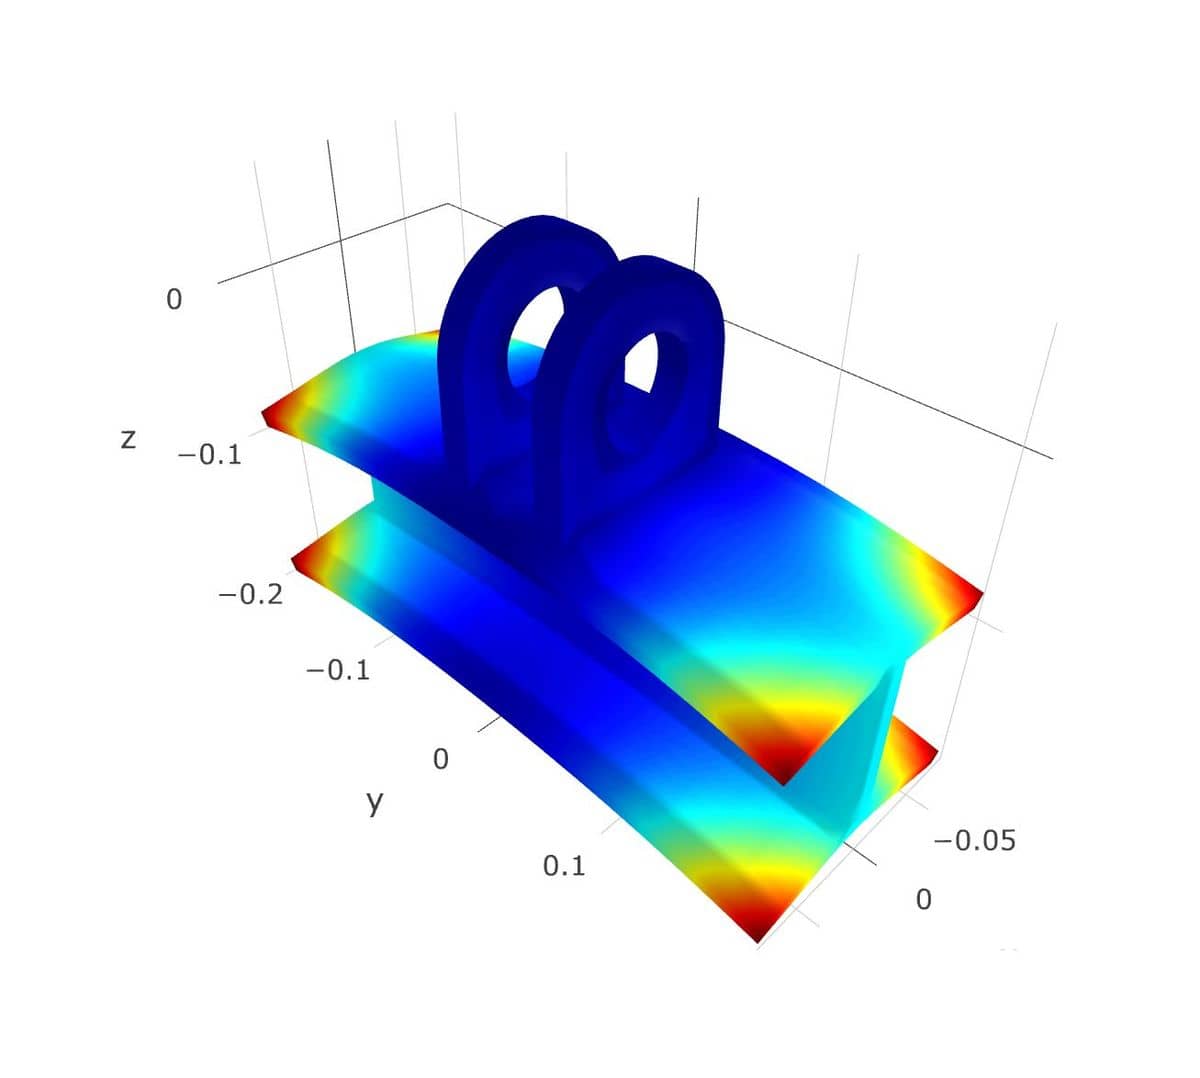
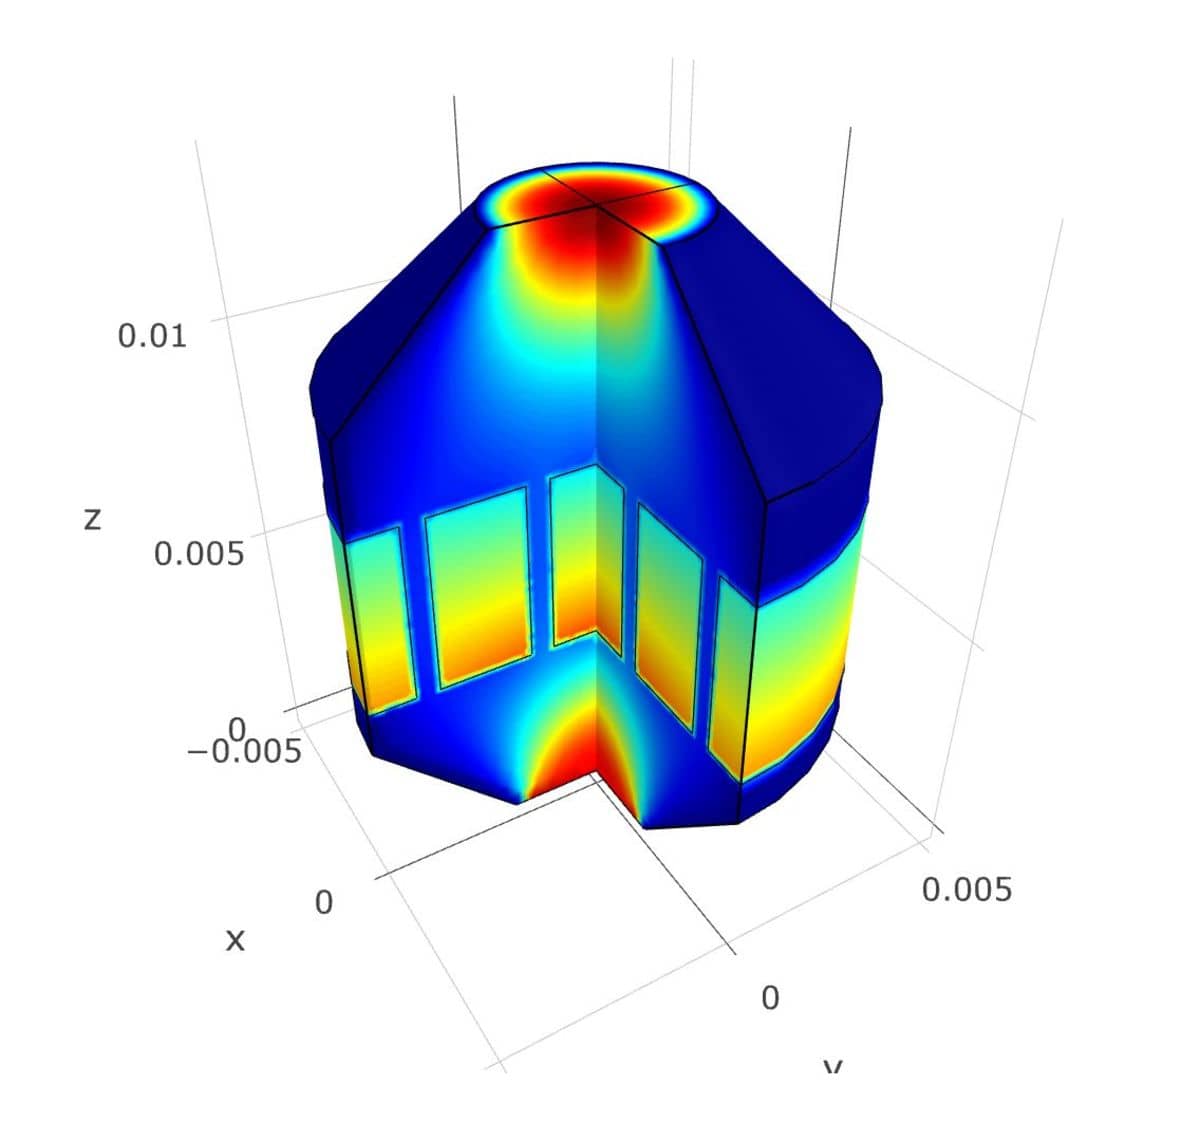
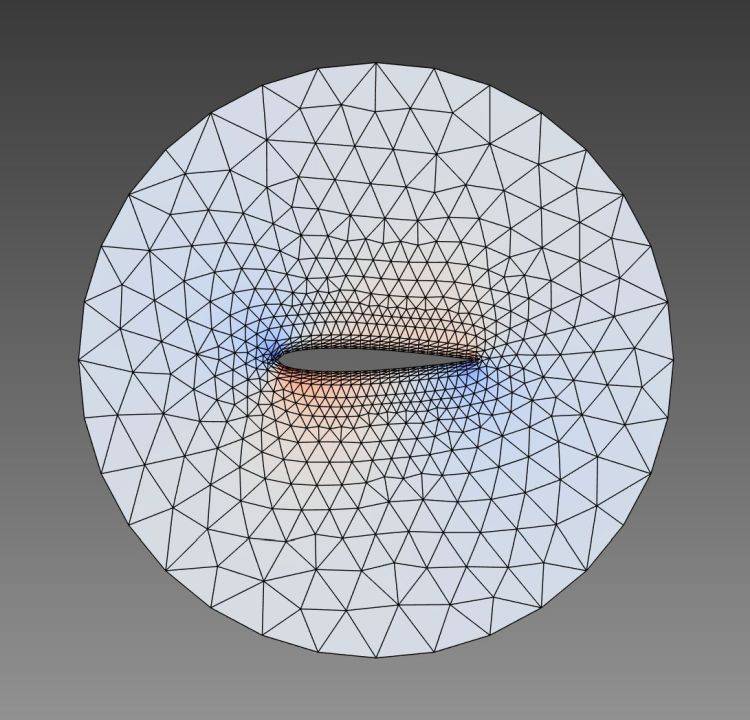
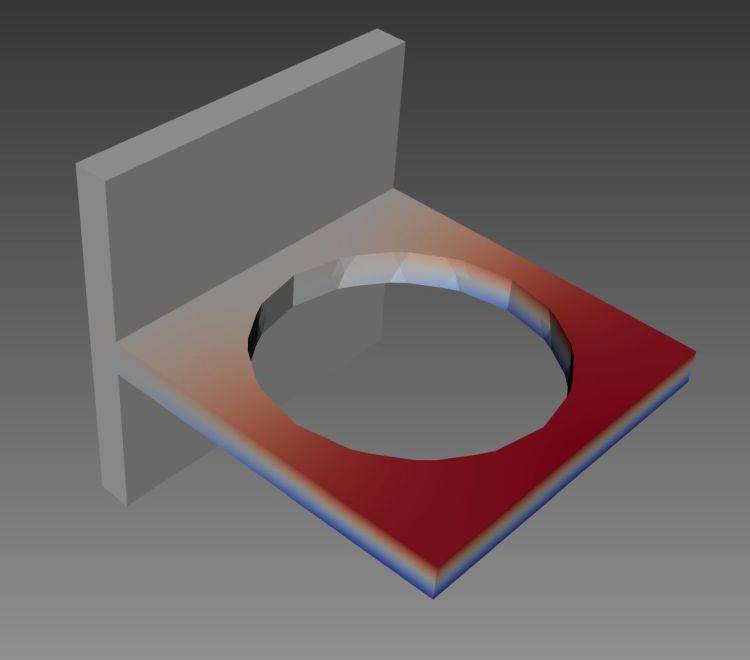
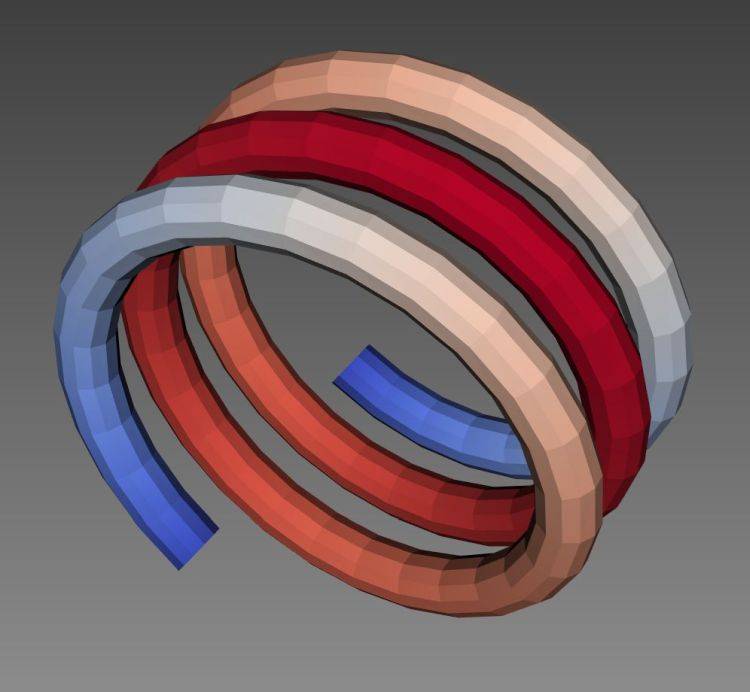
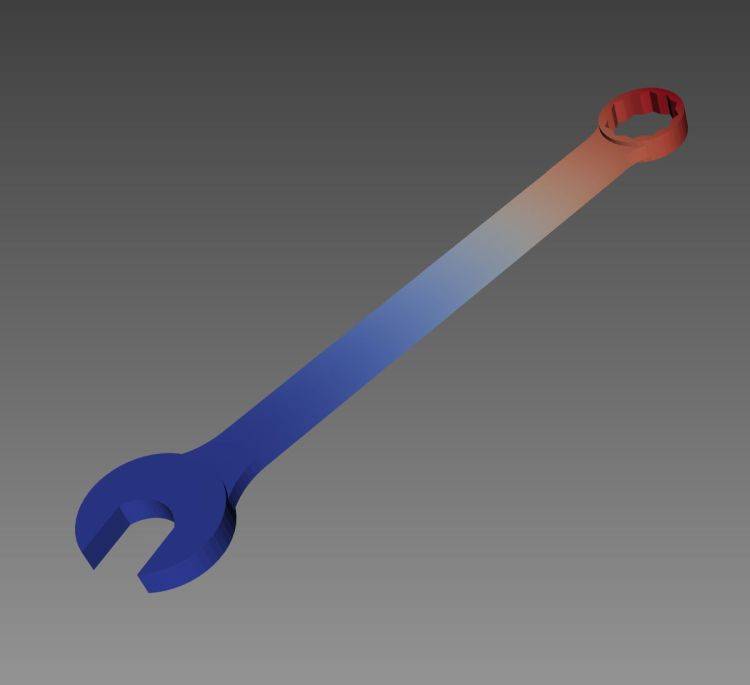
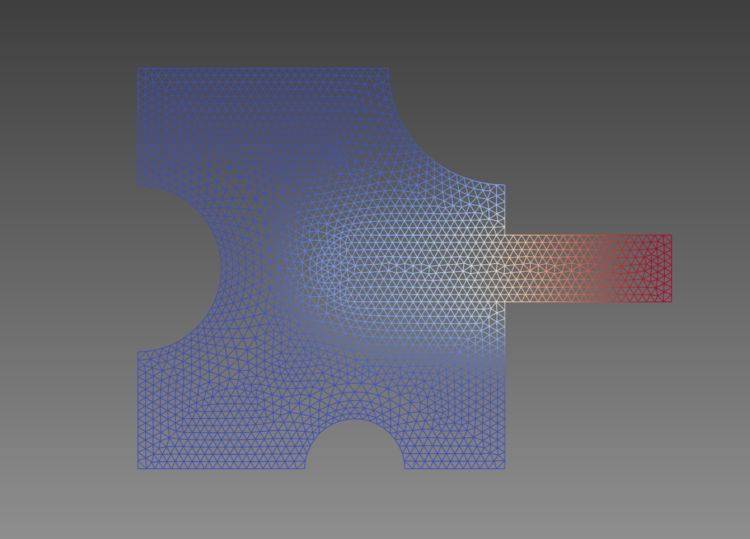
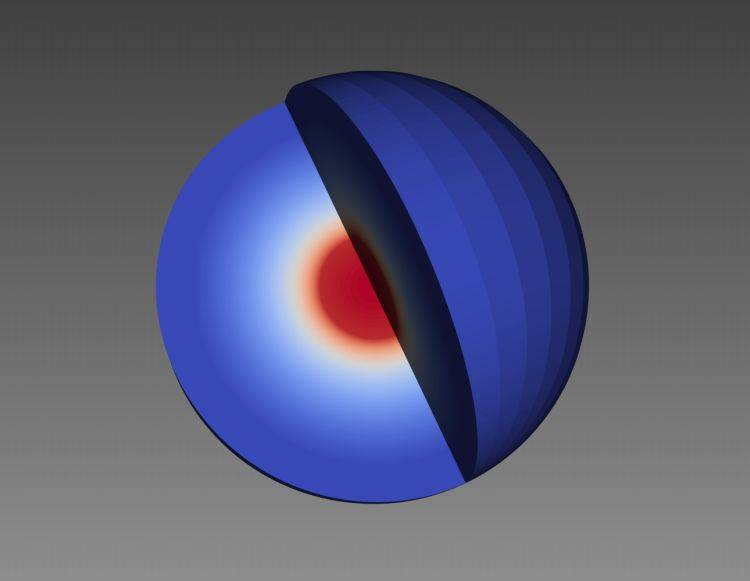
The following are examples of interactive web visualizations of simulation results generated using the FEATool Multiphysics toolbox. Simulation results can either be visualized in the toolbox GUI, processed using the MATLAB scripting and programming API, or exported as interactive plotly and ParaView Glance web visualizations, and shared or embedded as shown below. Click on any of the images below, and use the mouse cursor to interact with and explore the visualization and data after it has finished loading.


