Creating 3D Semi-Structured Grids Using Extrusion
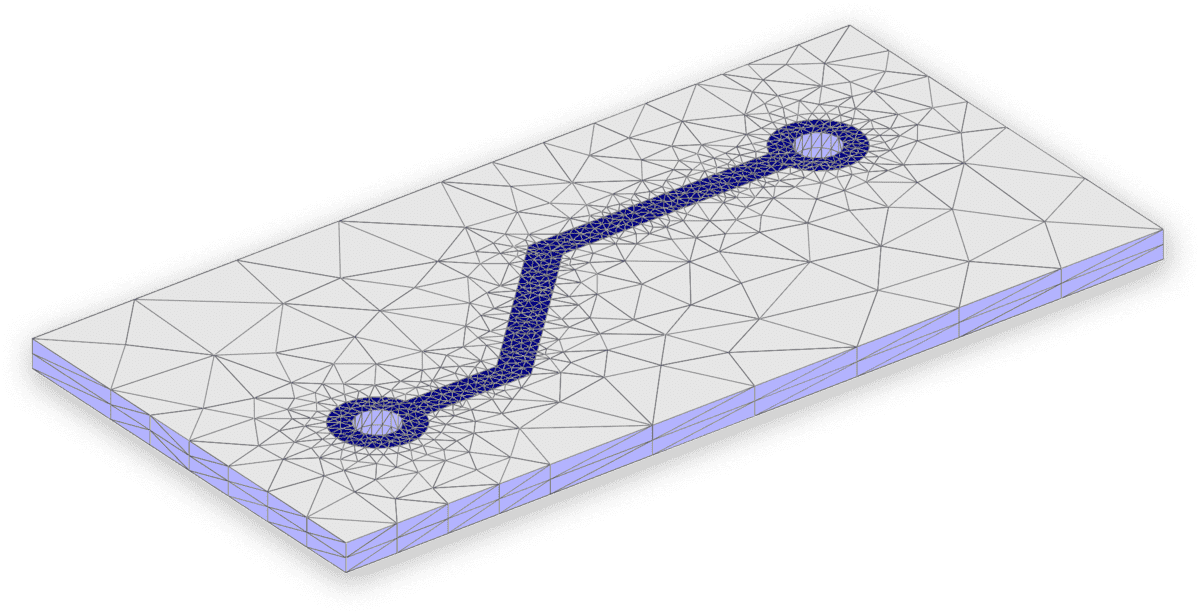
When generating grids and meshes for fully three-dimensional structures with constant cross section in one or more directions, it is often advantageous to first create a two dimensional grid and extrude it to 3D, rather than generate a full 3D grid directly. By using the extrusion technique more control over the grid …
Interactive 3D Data and Simulation Visualizations with Plotly and MATLAB
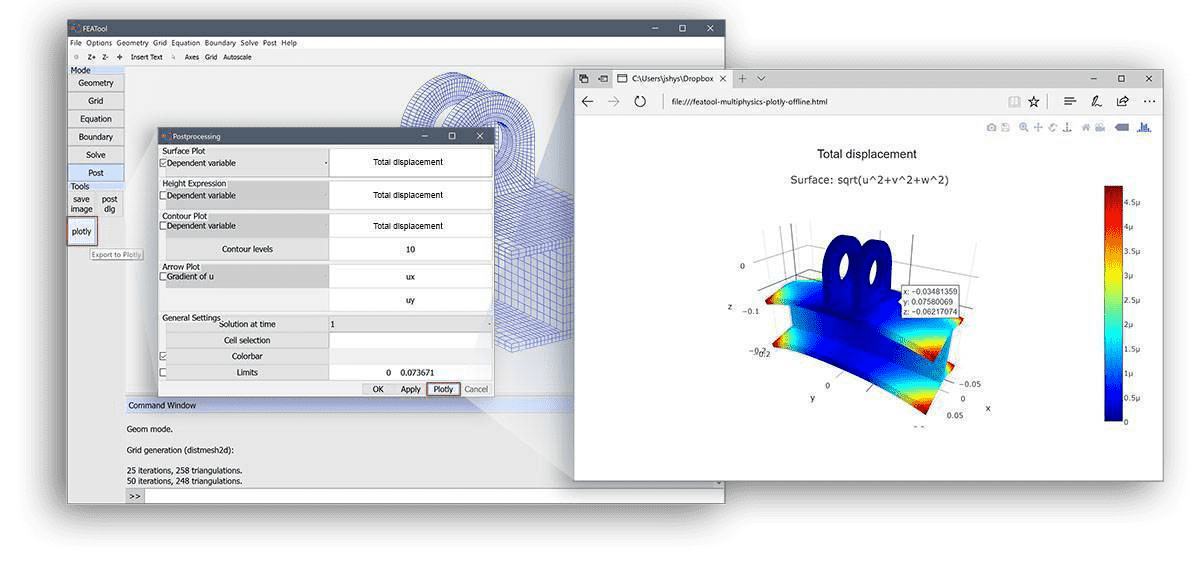
FEATool can be used to easily generate interactive surface, contour, arrow, and other visualizations of unstructured mesh and simulation data in 1D, 2D, and 3D. As FEATool also supports Plotly as rendering and visualization engine it is possible to create, interactively explore, and share simulation and unstructured …
Visualization and Postprocessing on Unstructured Grids and Meshes with FEATool Functions
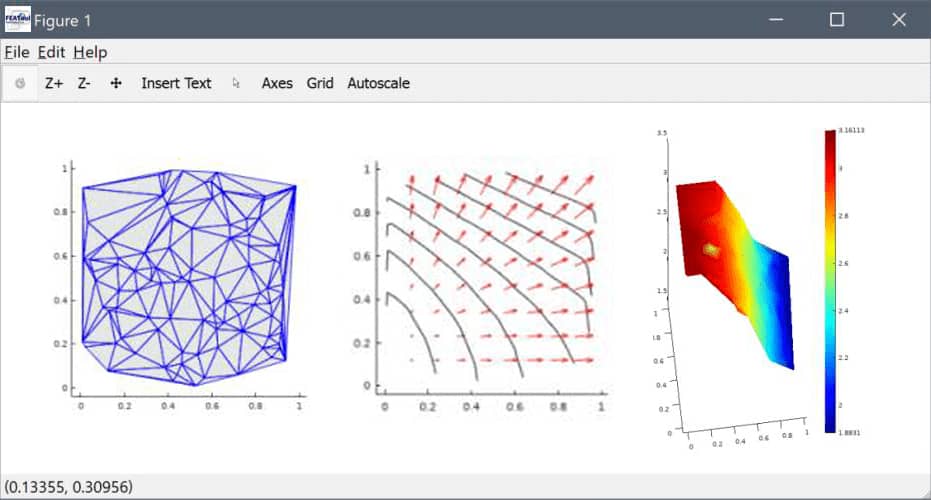
This post explains how to use MATLAB and the FEATool postprocessing function library to import, plot, and visualize general data on unstructured grids and meshes. Although MATLAB do include visualization functionality for surface and contour plots (with the surf and contour functions), it is currently limited to …


